This continues our series of blog posts for Pedestrian Safety Month. In this post, we’re looking at specific parts of Milwaukee, and what changes we’ve seen in pedestrian safety.
In our first blog post of this series, we looked at changes in where pedestrians are being hit in the last year. Here is that same data presented in a slightly different way:
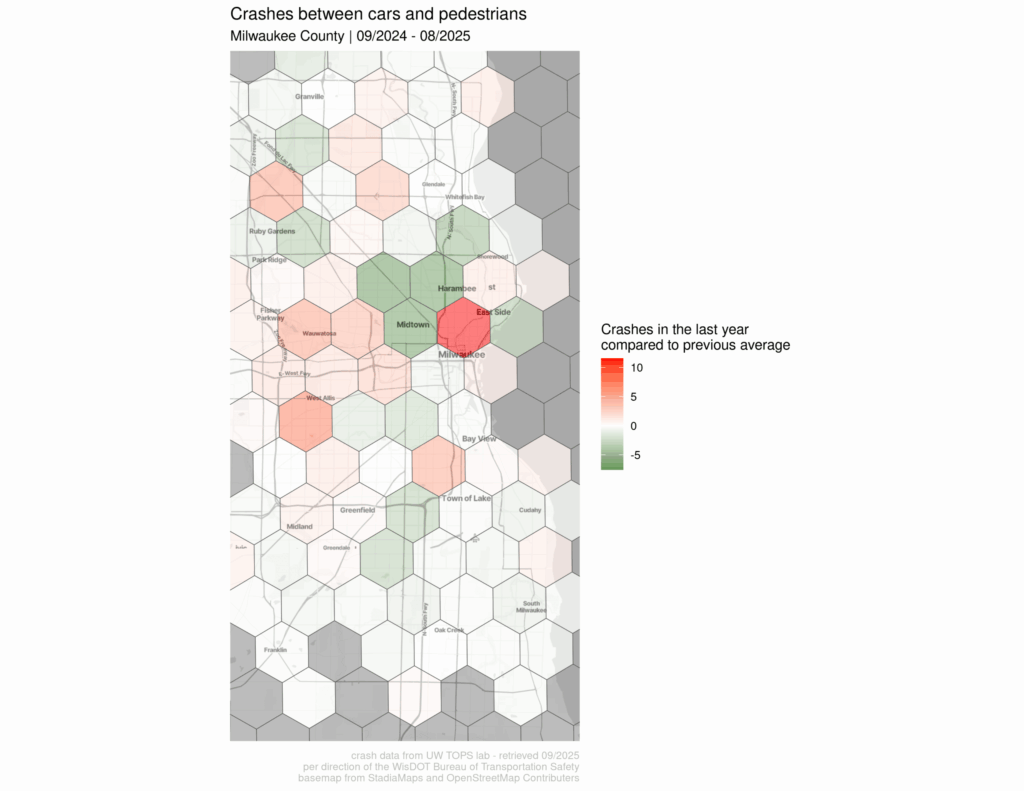
Each hexagon shows how many pedestrians were hit in the last year relative to what that area’s yearly average has been. A positive number means that many more pedestrians were hit (shaded red), a negative number mean that many fewer pedestrians were hit (shaded green).
The areas downtown and northwest of downtown have seen some big changes:
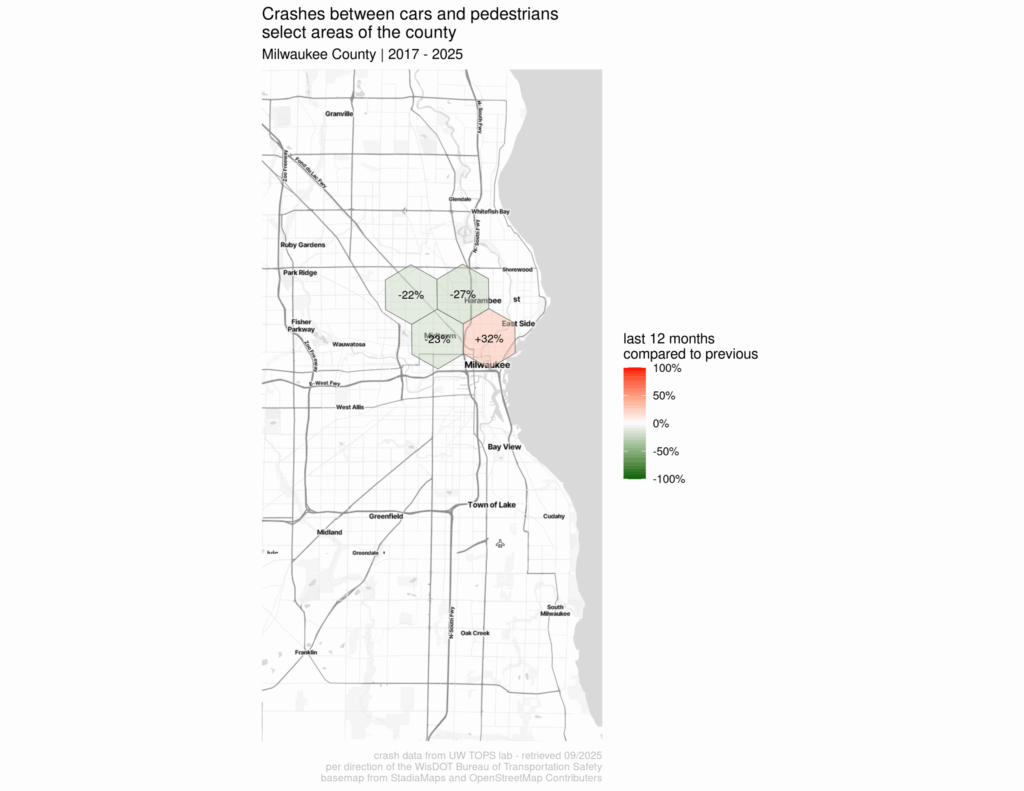
That’s partially because that’s where there are a lot of people walking in those areas. Let’s zoom into those areas to see what’s going on:
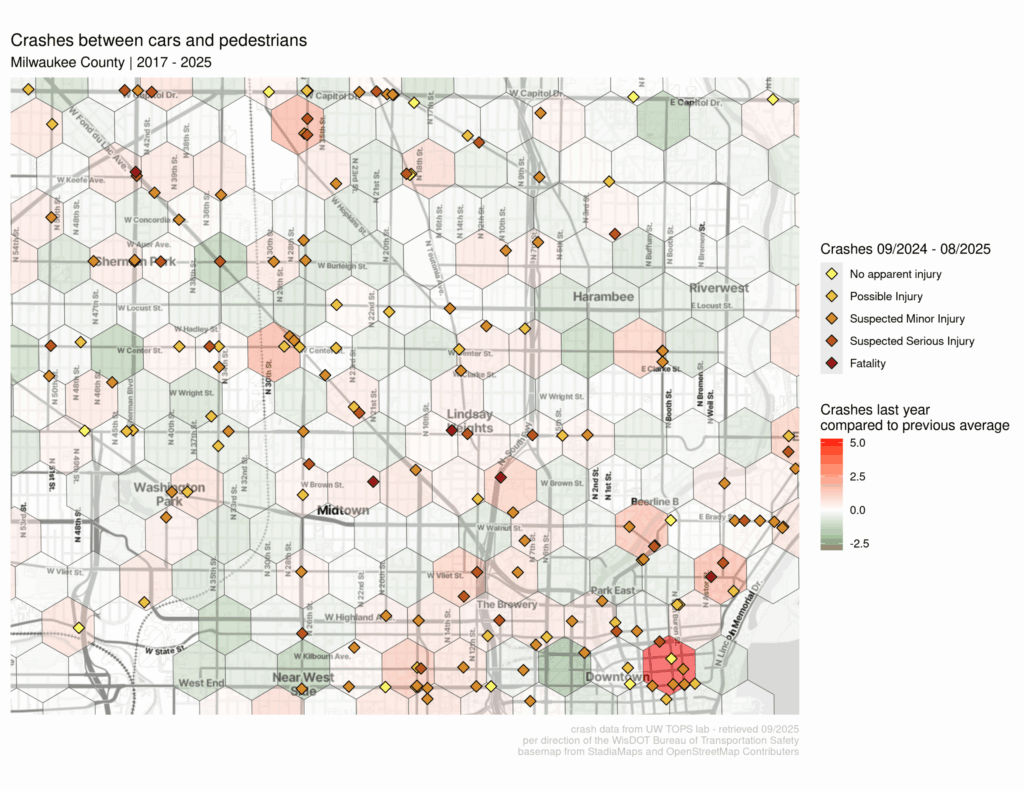
This is a zoomed in map of downtown Milwaukee, north to Capital Dr, and West to Washington Park. The map is showing the crashes from last year as colored dots (color indicates injury severity), and the areas are colored with hexagons indicating how this year’s crashes compare with the past. Red colored hexagons means that there were more crashes this year, green means there were fewer crashes this year.
While much of the map shows improvements (green hexagons), one part of downtown (E Wisconsin Ave between N. Water St and N. Prospect Ave) really stands out as seeing more crashes this year than in the past (bright red hexagon in the bottom right). Overall, this whole area has seen a 8% reduction in pedestrian-involved crashes this last year, and a 15% reduction in fatal or severe crashes – that’s a pretty good change.
Let’s start by looking at some areas that have improved
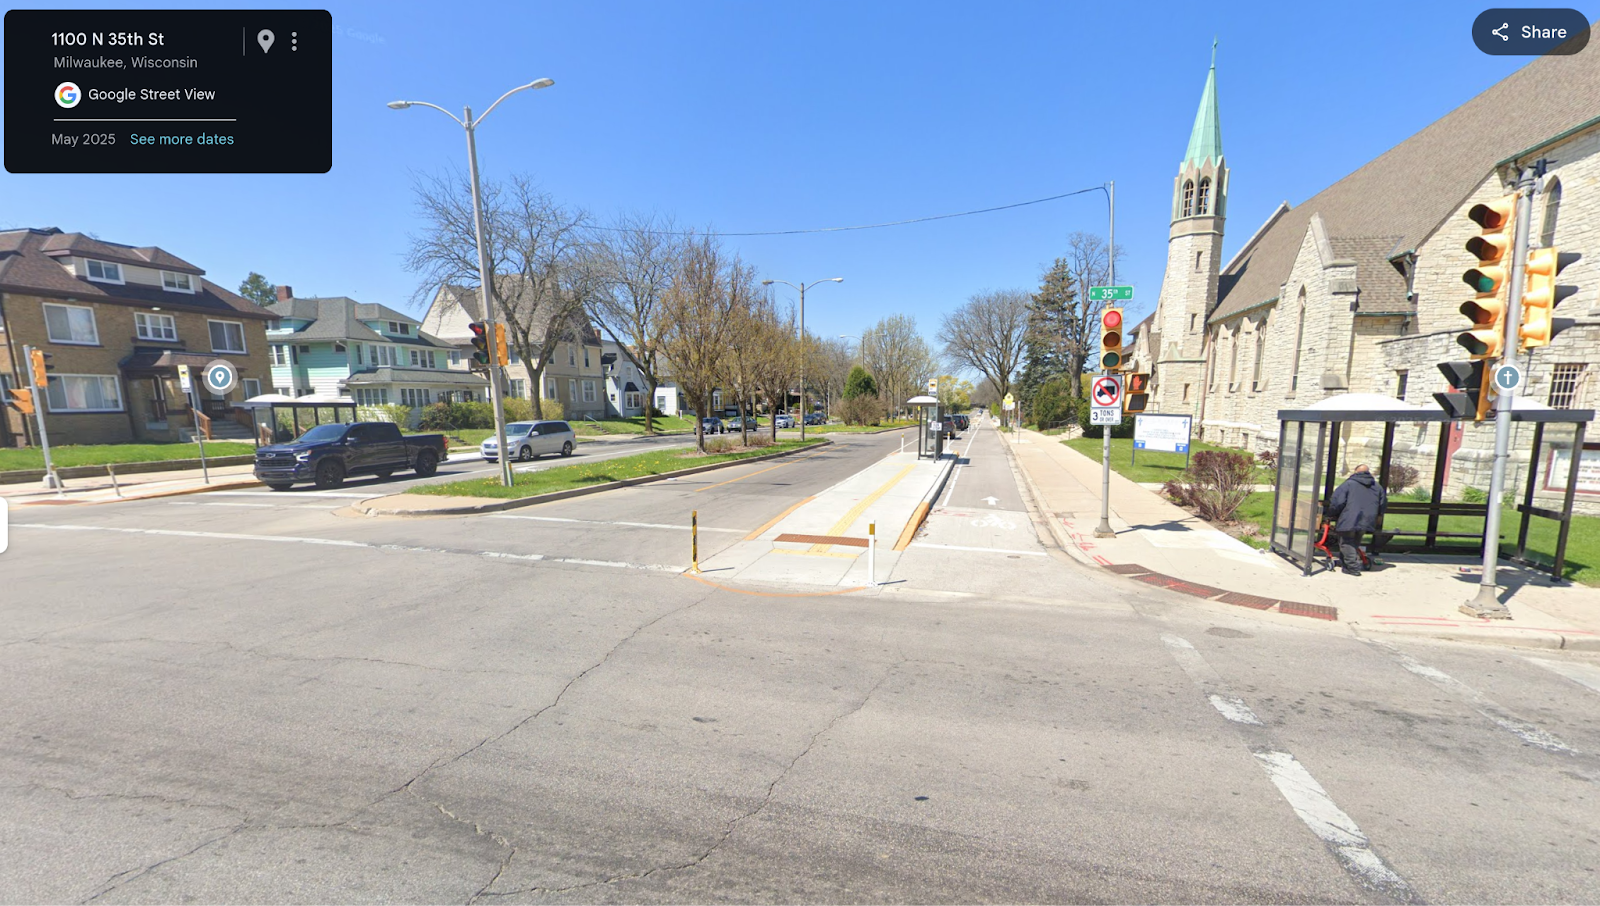
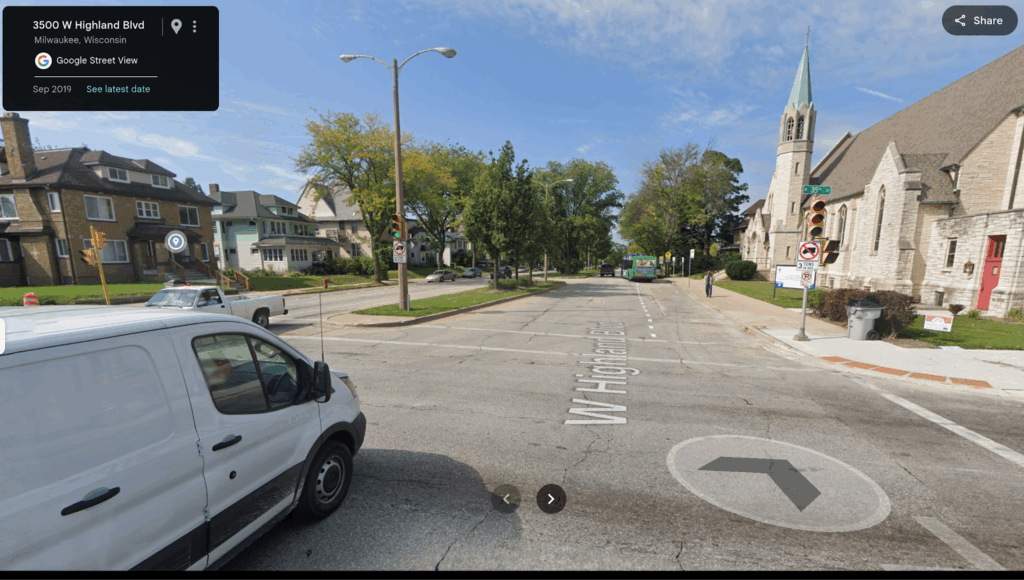
W Highland Ave & 35th St has seen a huge improvement! Between 2017 and 2022, this intersection and the stretches of road near it reliably saw several pedestrians injured in car crashes each year; in 2022 there were 5 crashes. However, in 2023, the city redesigned the stretch between Vliet and N. 35th St and the road has become much safer. In 2024 there was 1 crash that involved a pedestrian, and so far in 2025 there haven’t been any.
What Highland Ave looked like in 2019: 2 lanes of car traffic and an empty lane of parking.
What Highland Ave looks like now – 1 lane of car traffic and a bike lane protected by the bus stop island.
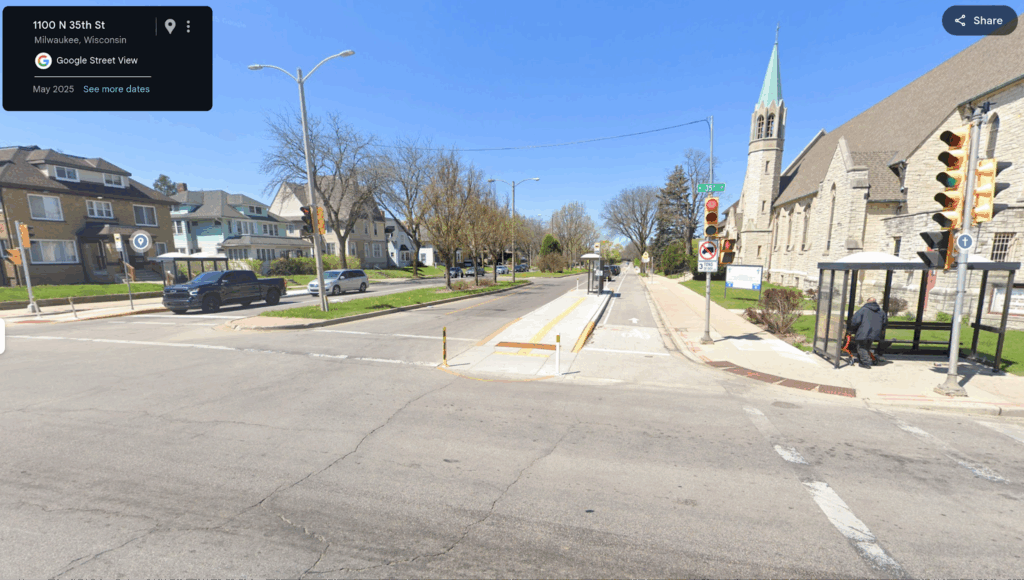
According to the city’s analysis, this project reduced speeding by 24% and reduced car crashes that cause injuries by 60%!
This project is a great one to highlight because it shows how infrastructure designed for one type of user can help others. The city added a “floating” bus stop here. That bus stop:
- Reduced the crossing distance for people walking from 3 lanes in each direction to 1 driving lane and 1 bike lane.
- Provided real protection to people biking in the bike lane.
- Reduced lane weaving and car crashes for drivers.
Building a floating bus stop here helped people taking the bus obviously, but it also helped people walking, biking, and driving. This area is a bus hub for the city and it makes sense for the city to prioritize effective transit infrastructure. Since most transit riders walk to and from their bus stops, improving transit is going to increase the number of people walking. Building transit infrastructure like this so that it helps people walk as well just makes sense.
MilWALKee Walks did a walk audit here after the redesign with a number of folks who have different mobility impairments. We heard from people who used mobility devices (walkers, wheelchairs, etc.) that they loved the reduced crossing distance of the new intersection. We also heard from people who are low vision that this type of intersection is new and different from the rest of the city, and it was hard from them to know what to expect when they stepped off the curb. New York City has been trying to solve this problem by having tactile intersection diagrams near the crosswalks so folks can learn layout of the intersection before crossing.
This city has been doing dozens of projects like Highland Avenue for years, and we’re cheering them on! You can see their list of current projects at their website.
However, some of these projects are at risk of losing funding as the Trump administration cancels grants for projects that improve pedestrian safety.
Now let’s take a closer look at the section of downtown that saw significantly more pedestrian-involved crashes this year: E Wisconsin Ave between Water St and Prospect Ave.
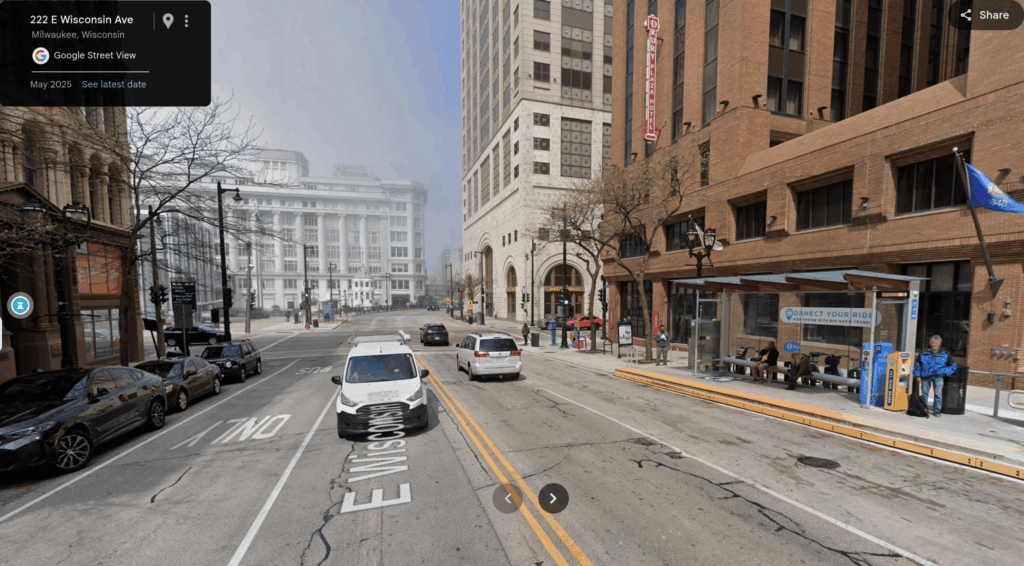
This stretch of road saw 5 pedestrian-involved car crashes in the last year, which is one more than the previous 7 years combined. We’re unsure as to why this is. What we do know is that:
- This area is the core of downtown Milwaukee and there are a ton of people walking everywhere. There are museums, office buildings, hotels, conference centers, restaurants. It’s also the end of the Connect 1 BRT line, which brings in a lot of people on foot. This is an area that should have very pedestrian friendly infrastructure, and it doesn’t yet.
- This stretch of road has a 30 MPH speed limit, which is too fast for such a pedestrian heavy area.
- Looking at the specific crashes in the last year, about half involved the driver turning right on a red light. Right turns on red are very dangerous, and many cities are starting to rethink them.
Milwaukee’s Downtown Area Plan calls for improving the pedestrian safety of Wisconsin Ave and Water St, these will be welcome improvements.
How to learn more?
Click here to read a summary of Milwaukee County’s 2024 pedestrian fatalities. You can also explore our interactive map, showing where pedestrians and bicyclists have been involved in motor vehicle crashes.
If you’re interested in how these maps and figures were created, you can see the code that generated them here.
This blog was also published on the WI Bike Fed blog, as part of Pedestrian Safety Month.