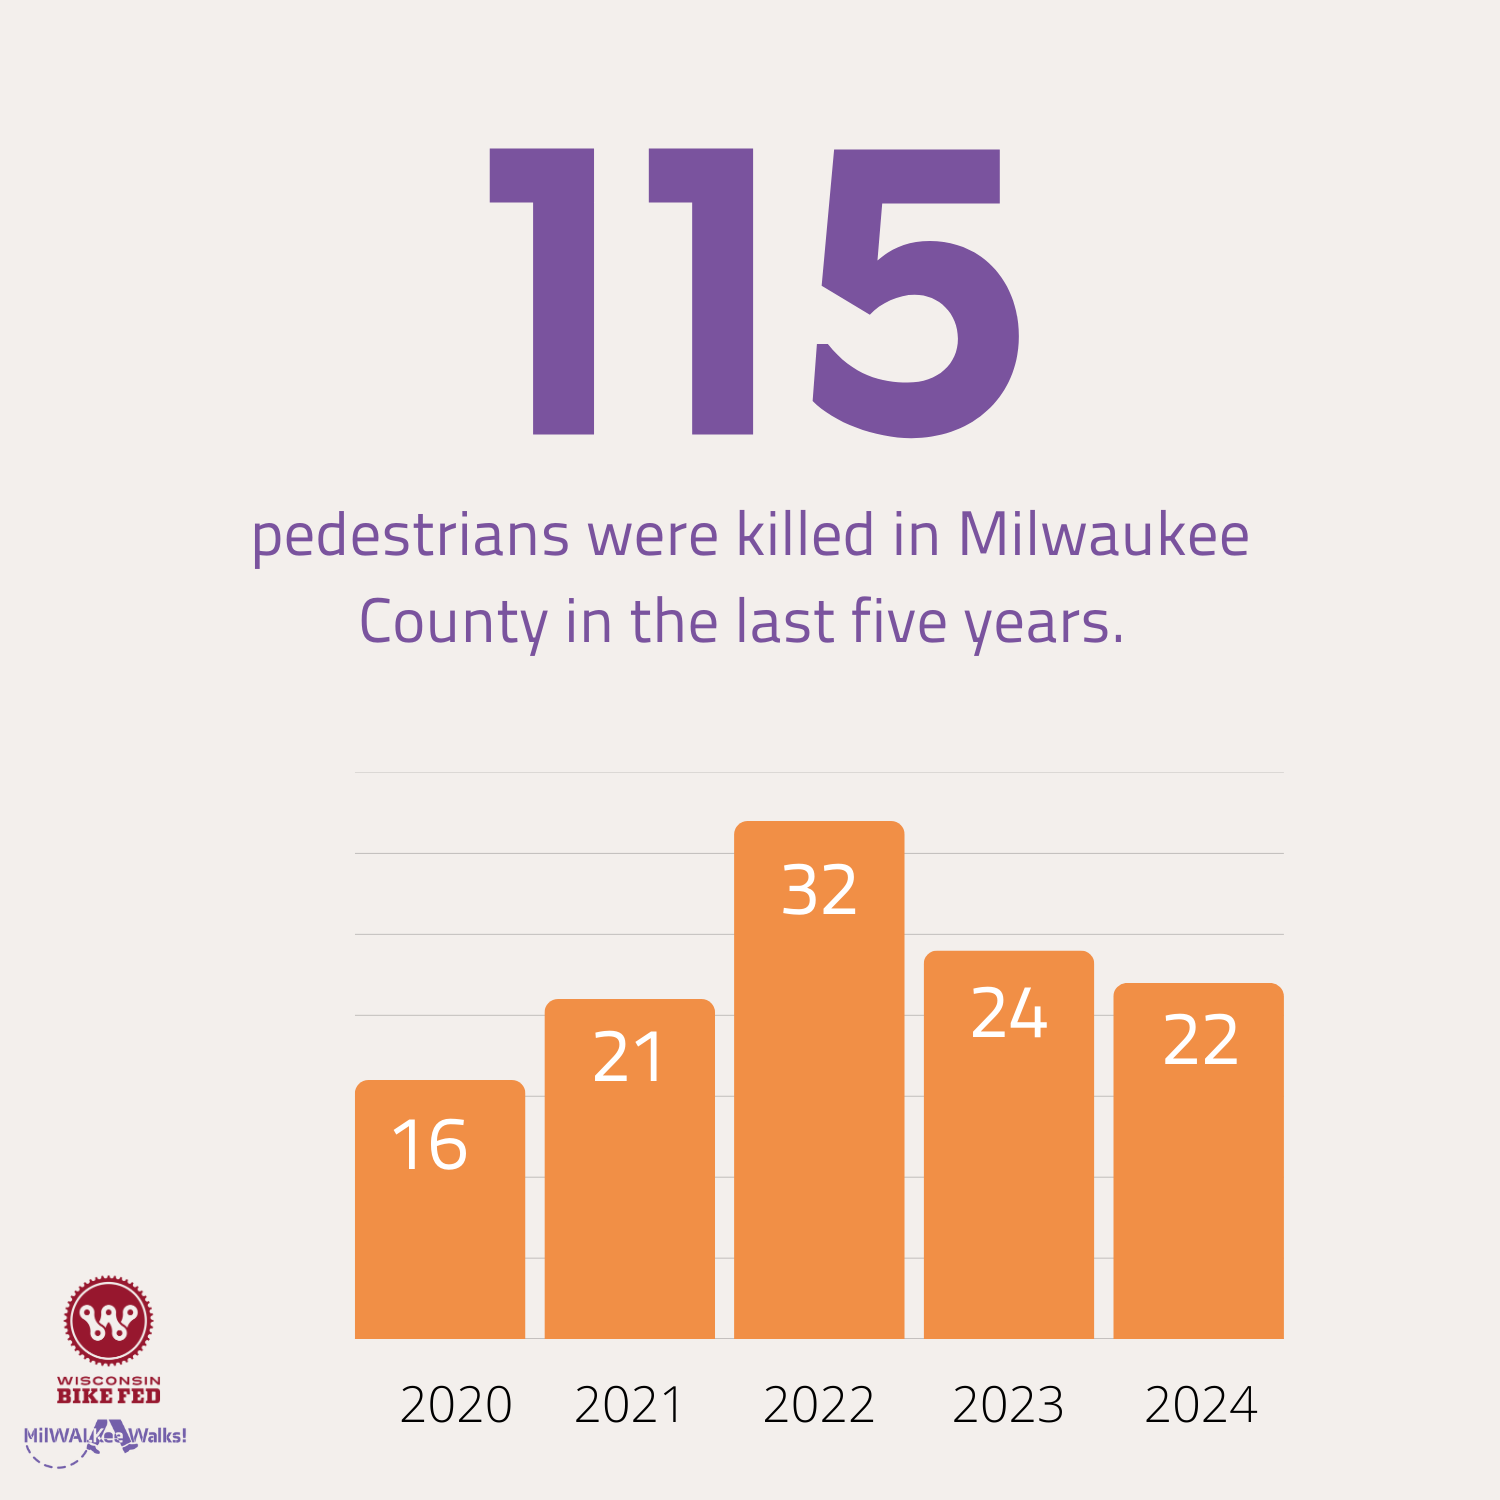
Data informs every aspect of our work. With limited resources and staff time, we try to focus our efforts on neighborhoods on or near the Pedestrian High Injury Network in the City of Milwaukee (as designated in this report). We also work with communities across Milwaukee County. To understand which communities are our highest priority (and what corridors in those communities are where most pedestrian crashes occur), we review data from Community Maps.
To make this information easier to understand for the general public, Bike Fed staff member Ben Varick created a map of injuries and fatalities of vulnerable road users (people walking and using bikes, years 2017-2024).
The crashes marked on the map are those that were reported to the police or that involved an ambulance. Many crashes do not get reported and thus do not appear on this map.
- When the map is zoomed out: areas with more crashes are highlighted with darker colors (a heat map), to show relative danger for pedestrians and people biking.
- When the map is zoomed in: you can see the individual crashes that have been reported in the last 7 years. The color of the circle represents how severely the pedestrian or bicyclist was injured. You can hover your mouse over individual crashes to see the date of the crash, the injury severity, and the age of the pedestrian or bicyclist.


