This post is exclusively about the City of Milwaukee. We intend to cover trends in Milwaukee County in the future.
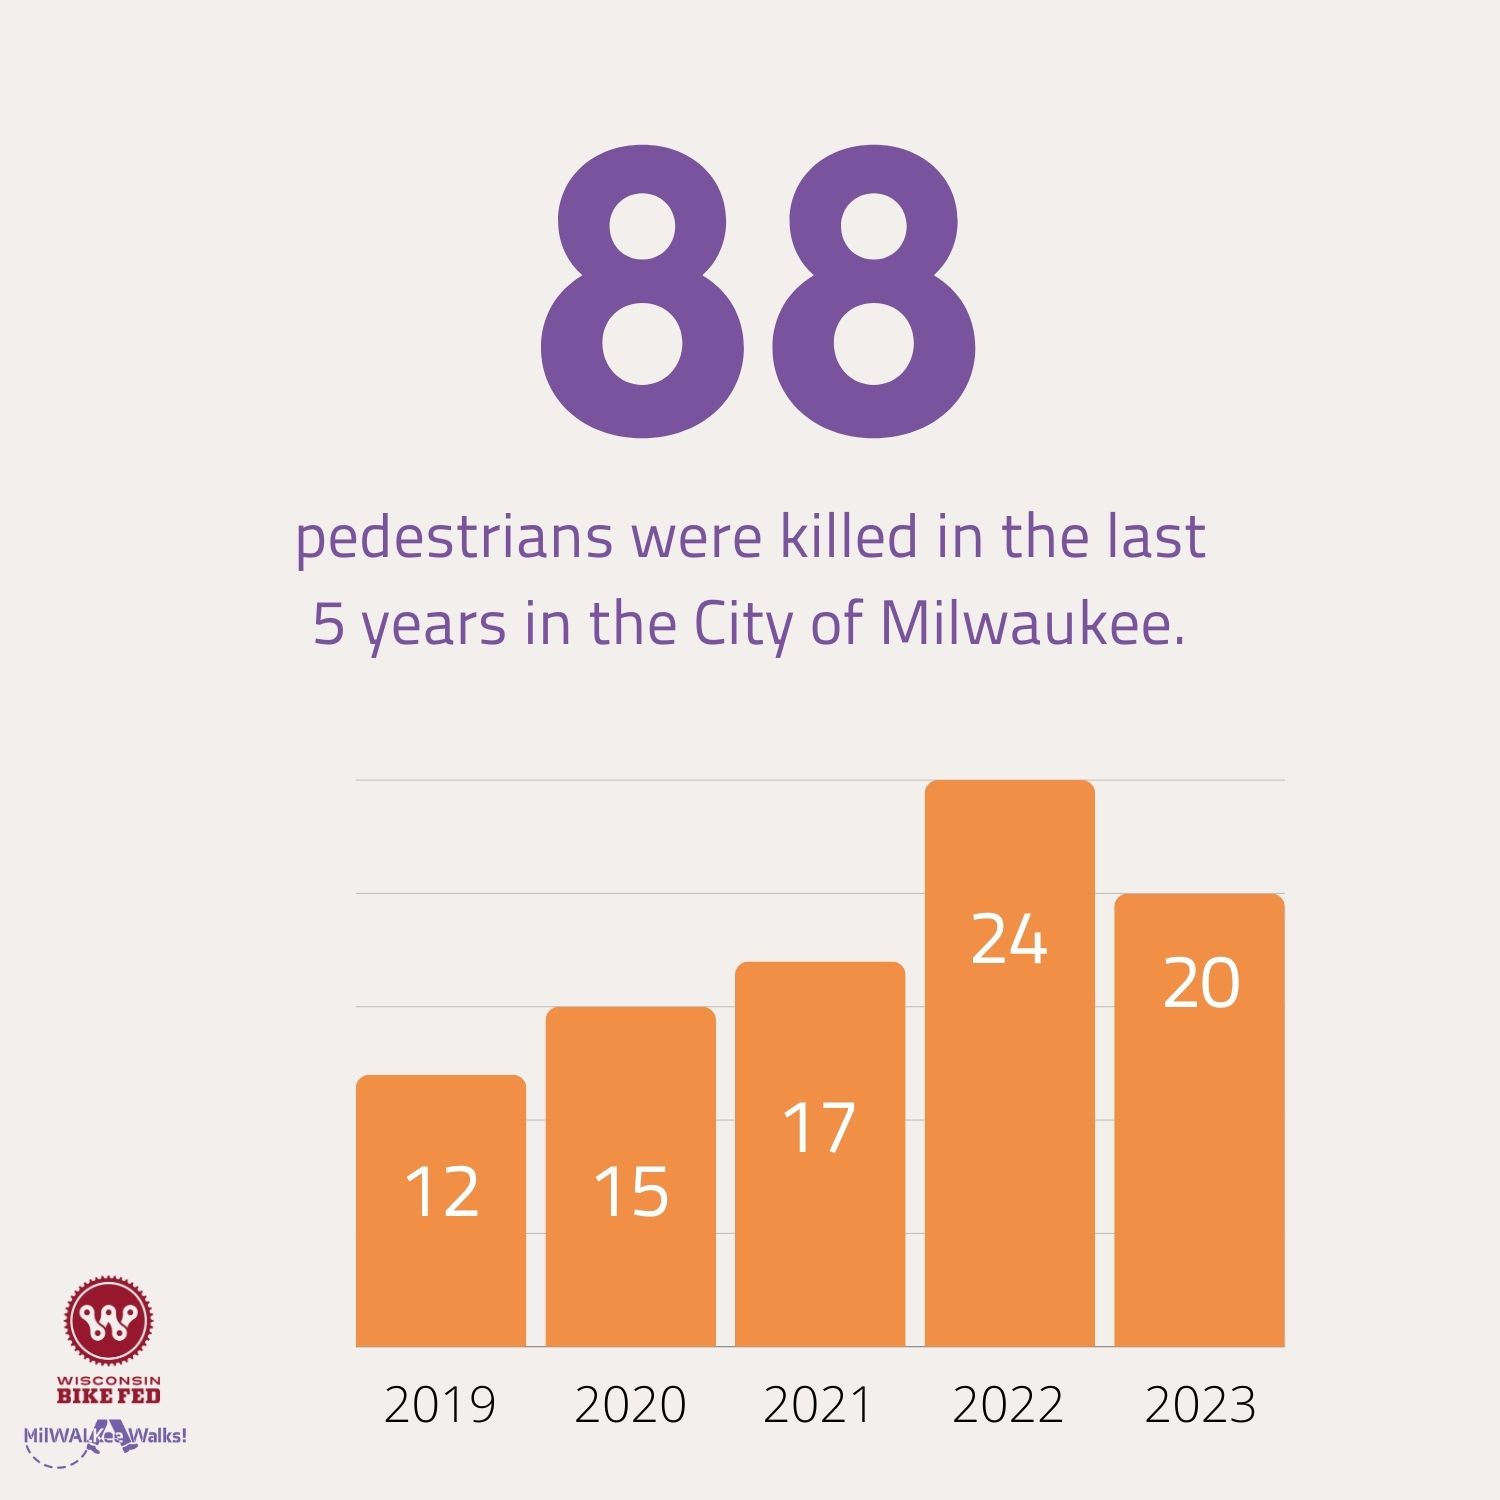
There is good news: Milwaukee saw fewer pedestrian fatalities in 2023 than in 2022.
The bad news is that we are still far above even the trend from five years ago. In 2019, 12 pedestrians in the city were killed in traffic crashes. While that is still far too high, that is significantly lower than recent years.

A note on data
Traffic crash data is difficult to analyze, although Wisconsin has some of the best data in the country. Crash data involving injuries or deaths can take weeks or months to appear in Community Maps, which is the main source of data for both our work and for most municipalities and counties. This is due to law enforcement investigation and the potential changing health status of someone who was hit.
Community Maps does not show the data we analyze (race, gender, and more) in a discrete way. For example, you can search for crashes that occurred in a certain year with a “Pedestrian” flag, and Community Maps will present a result of number of crashes, number of fatalities, and number of injuries. A part of what takes us a long time to present this information is that a crash involving a pedestrian does not necessarily mean the pedestrian is the fatality(ies) listed.
MilWALKee Walks staff read every pedestrian fatality crash report to both collect data about the victims of traffic violence, and to better understand what behaviors and designs are contributing to these deaths. Finding race, sex, and other information means manually reading reports and manually tracking information about drivers and victims.
Milwaukee County has released a new tool called the Milwaukee County Motor Vehicle Collision Dashboard. This dashboard relies on the same data from Community Maps, so many of the challenges we discussed are present. The dashboard also includes all crashes, including property-damage only crashes. While this can be valuable, users should be cautious as we should care most about ending fatalities and life-changing injuries.
The City of Milwaukee is likely to release a similar tool, although focused on the City of Milwaukee and on fatality/injury crashes.
What kinds of crashes are we seeing?
For each crash, we read the law enforcement summary of the crash, and we analyzed the location in Google Maps Street View.
Similarly to last year, we see a range of types of crashes: daylight, nighttime, legal use of a crosswalk, crossing the street without yielding to vehicles, and more. Because a victim cannot speak for themselves, we cannot know their intents, entire actions, or reasoning. We will try to provide some broad insight into what we read.
In the case of a death or serious crash, the following is important to remember:
- A person who has been killed can’t provide their side of a story.
- Crashes are physically and emotionally traumatic. It is very common to not remember what happened before a crash. This is true for victims, drivers, and even witnesses.
- Higher speeds means that drivers are less likely to see pedestrians.
- The built environment impacts the behavior of both drivers and pedestrians.
- There is often poor education about pedestrian rights.
Crossing outside crosswalks
Crashes included a number of people who crossed a street not at a crosswalk. It is important to note that this is not necessarily illegal in Wisconsin: our state has no such “jaywalking” law. Pedestrians may cross a street outside of a crosswalk, if they yield to vehicles. Many people do this frequently when parking across the street from a business, for example.
In looking at the location of crashes, there are understandable reasons why someone might do this. Many crashes occur near businesses, job centers, and other places people may be going to. Many also occur on streets with very busy intersections with crosswalks that are relatively widely spaced. A person might choose to cross not at a crosswalk for any number of reasons, including unpleasant weather, being tired, or feeling that it is safer to cross with only having to navigate one-way traffic, rather than navigating an intersection with vehicles turning.
Crossing within crosswalks
Others crossed at legal crosswalks, but these were often uncontrolled. Pedestrians have the right to cross at a crosswalk, and drivers must yield. However, crosswalks that are uncontrolled (do not have stop signs or signals) are likely to see much worse yielding behavior by cars, and potentially poorly-maintained paint or low-quality streetlights.
All of this speaks to how we should design our streets and plan our land use to encourage the safest possible behavior of all road users, including people walking. Midblock crossings, better streetlights, and shorter crossing distances (through curb extensions/bumpouts) are all critical, as is managing driver speed.
Who is most impacted?
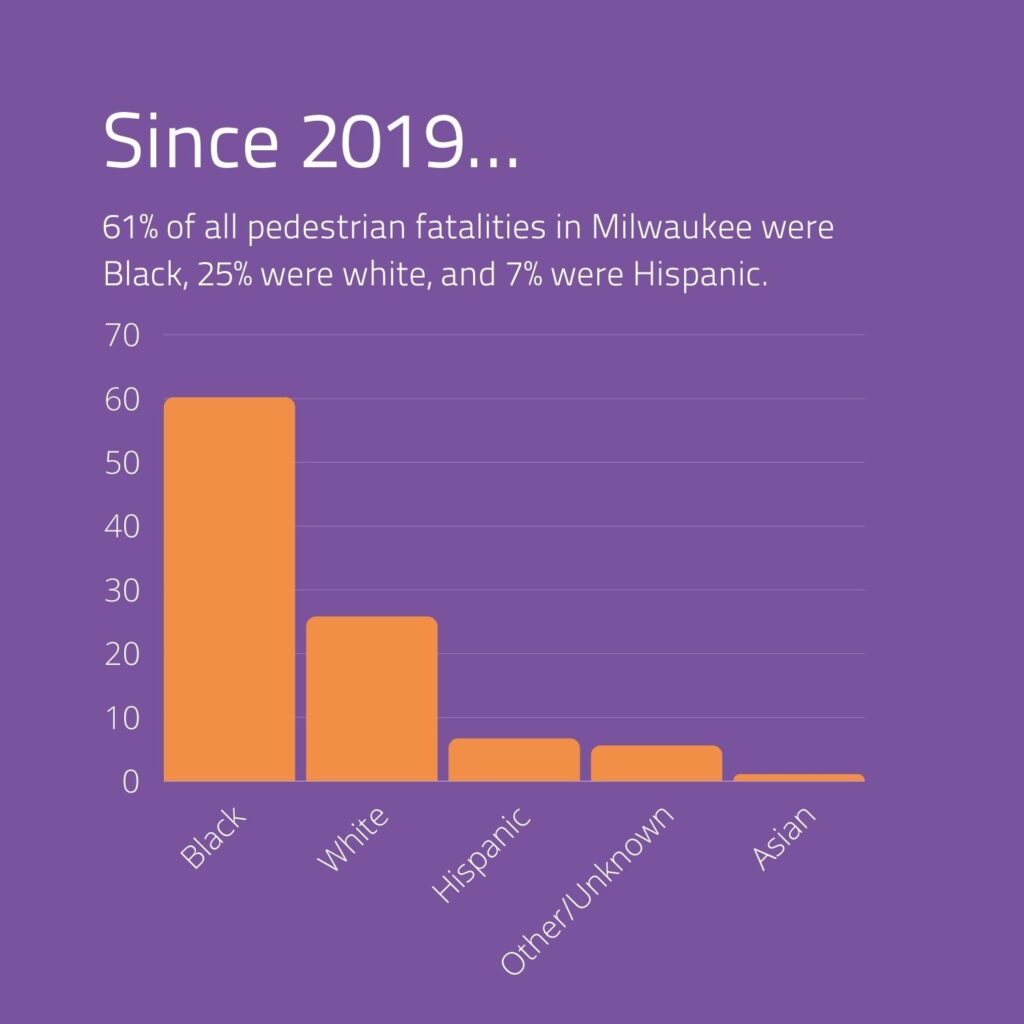
As we discussed in our analysis last year, Black Milwaukeeans continue to be disproportionately impacted by traffic violence. In 2023 and since 2019, Black Milwaukeeans were about 60% of pedestrian fatality victims. Black Milwaukeeans make up 38.6% of the city’s population (US Census Population Estimates Program).
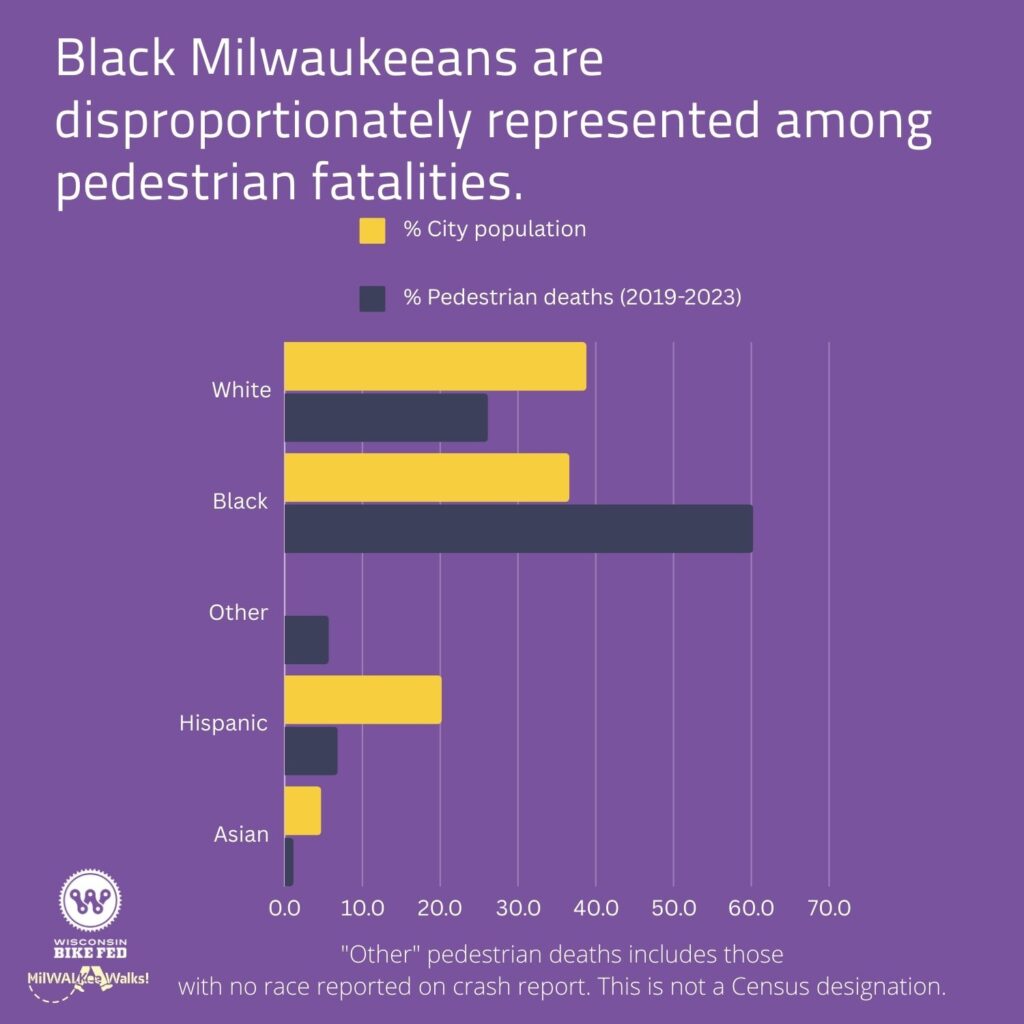

An important distinction is that just because crashes are disproportionately happening to a group of people does not mean that their behavior is driving crashes. Instead, understanding our city’s segregated geography provides important context.
Where are crashes happening?
When we discuss disproportionately-impacted groups, one explanation can be about culture, behavior, or education of either the drivers or victims. However, it is first important to consider geography.
According to Milwaukee County staff, more than half of crashes occur on just 10% of streets. When we look at the Pedestrian High Injury Network, it’s easy to see where some of those streets are. They are not residential roads, or generally narrower streets. They tend to be streets with multiple lanes, designed for faster speeds (30-35 mph), where pedestrian access and safety has been less considered in design. Many of these streets are on the city’s predominately Black north side.
One street that illustrates the importance of design is Locust Street. Locust Street west of MLK Drive to Fond Du Lac Avenue (including through predominately Black neighborhoods such as Harambee and Amani) is on the City’s High Injury Network. Locust Street east of MLK Drive (predominately through Riverwest) is not on the High Injury Network. Riverwest famously fought and won a battle to not widen Locust Street in the neighborhood — a success celebrated annually at the Locust Street Festival.


The Pedestrian High Injury Network is how MilWALKee Walks determines where we focus our efforts. You can see how it was determined and which streets and intersections are included in the City’s Crash Analysis (page 16):

If we look at just pedestrian fatalities in the City of Milwaukee since 2019, the trends do generally match the Pedestrian High Injury Network:

Street design is one of the most important factors to consider in understanding why these crashes are happening. A street designed for drivers to go quickly is not one that is designed for pedestrians to walk safely.
But why have things gotten worse?
Rightfully so, some may ask why roads that have remained the same for decades are suddenly seeing a rise in crashes.
First, it’s important to note that redesigned roads are a benefit for all beyond just preventing death. A road where children and grandparents can safely bike and walk together, separated from traffic, is a better road that serves more people. A road where pedestrians can be seen more clearly is a better road for everyone, including the most careful drivers who are invested in not causing harm. Redesigned roads boost economies and make walking more appealing for a wider range of people, which is a benefit to activating our street, thus making them feel safer for people who might fear harassment or crime on a mostly-empty sidewalk.
We know nationally and internationally that road design plays a role in traffic deaths. This does not mean that education, driver or pedestrian behavior, or that culture does not also play a role. There is no definitive reason why things have gotten worse in recent years, but we know that Milwaukee is not alone in these trends.
The choice to engage in dangerous behaviors such as passing on the right in the bike lane, running red lights, or rolling stop signs is just that: a choice. We have to educate all road users about road laws and the why behind them, because we cannot redesign our roads all at once. Drivers may roll stop signs now, for example, because they have poor visibility due to cars parked up to the intersection. But the choice to not stop first, look for pedestrians, and then progress slowly, is a choice that can lead to death or injury for someone else, including pedestrians.
Why speed matters
In order to understand why we need to educate people about speed and why our roads need to be less “comfortable” for speed, we need to understand why speed matters.
Speed is more than speeding. Speeding refers to going above the set speed limit of a road. Speed is sometimes noted by law enforcement as a factor in crashes, but this generally refers to a person driving above the speed limit, and usually significantly above the speed limit.
But the physics of crashes doesn’t care about what is legal, or “close to legal.” A person driving 30 mph on a 25 mph road may think that is a “reasonable” speed, and they may not be cited for speeding in the case of a crash. But a person going 30, or 35, or higher, is significantly more likely to cause a crash and to kill or seriously harm another person when they do. There’s a few reasons why.
First, speed causes us to see less around us. The image below shows how a driver might believe that someone came out of “nowhere.” Of course, this statement doesn’t make sense: someone always appears from somewhere. However, if a driver is driving too fast, they will not see someone. The hardest part of driving is always being prepared to stop.
Second, higher speeds make it less likely to be able brake in time to avoid a crash. (Safe) drivers know to keep a larger following distance on the highway because you are going a faster speed and will need the space should you need to brake. Yet there is a shockingly large difference in reaction and braking distances for even 20-40 miles per hour.

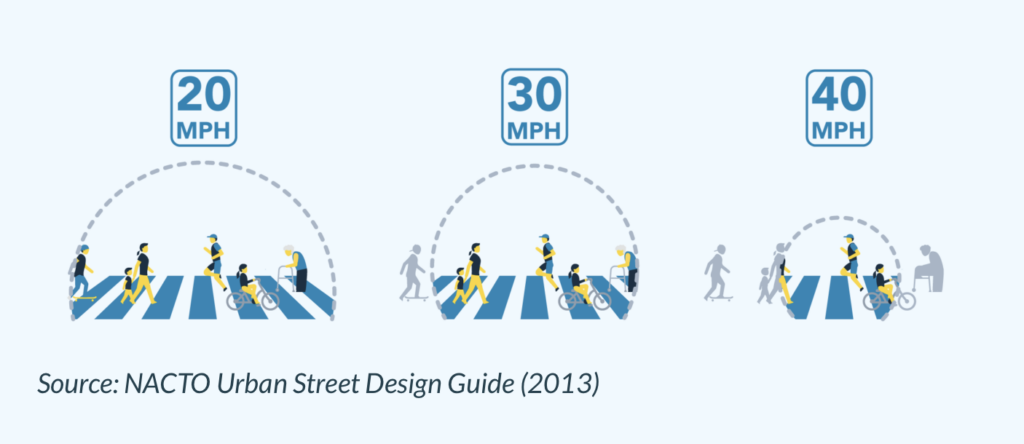
Finally, if you did not manage to avoid the crash, there is the crash itself. If you hit a person walking at 20 miles per hour, they have a much better chance of surviving that crash (8% risk of death) than being hit at 30 mph (20% chance of death) or 40 mph (46% chance of death).

These risks increase when hit by a dangerously-designed vehicle, such as a large pickup truck or SUV with a high hood. Those vehicles also make it more difficult to see pedestrians, and their heavier weight make it more difficult to stop.
Learn more from the Vision Zero Network.
What’s working?
While we saw a slight decrease in pedestrian fatalities from an all-time high in 2022, we should be careful to ascribe that decline to any one solution. But we can learn from other communities that have achieved Vision Zero. One of the key solutions to ending deaths and injuries is changing dangerous roads into “Complete Streets.”
The City of Milwaukee has taken on a range of traffic-calming measures. These include the “bump out” curb extensions all over the city, restriping projects, rapid projects, and full reconstructions. For example, on Lapham Boulevard, a project to reduce driving lanes and add parking-protected bike/mobility lanes reduced speeding by 69%. Oklahoma Avenue saw speeding reduce by 37%.
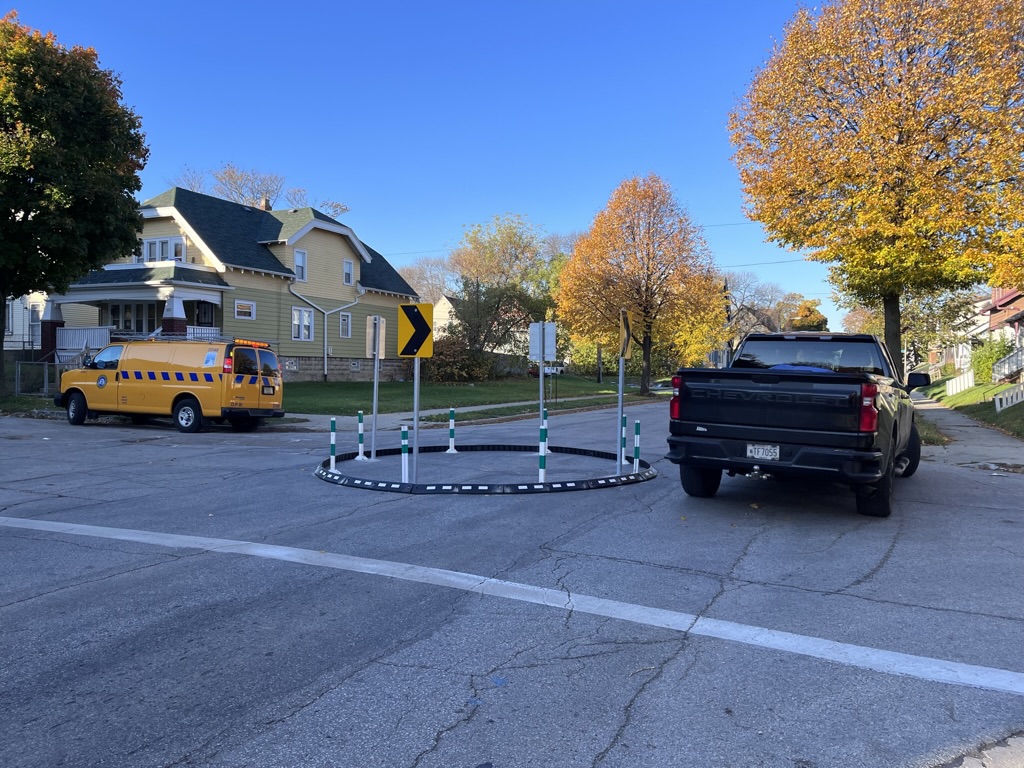
MilWALKee Walks has actually done some of our own speed studies. In one case, we studied the before and after effects of the below “semi-temporary” traffic circle at Locust and 25th Streets. We worked with Amani United and the Dominican Center to educate residents about traffic calming street changes, and AARP funded the circle. Speeding decreased by approximately 70% eastbound and 46% westbound after the installation.
We cannot achieve zero deaths and fatalities without redesigning our roads, especially ones where people have a wide area to speed, or where bike lanes are just painted lines for “passing on the right.” But there are other strategies to consider as well.
Driver education has seen a boost in the past year, with additional funding to provide students with education. But it’s not just the youth: throughout our engagement process in Amani, we met residents who cared deeply about the issue but did not realize they were likely speeding as well. Speed limit signs were often missing, and many residents did not realize the limit was 25 mph, not 30 (the default limit throughout the city is 25 mph, by the way). The City will also be looking to release an anti-speeding public campaign this year.